
The Home Health Clinician Retention Playbook
How to keep the nurses and therapists your agency cannot grow without.
Plain text
Read it as text.
25.5%
annual RN turnover in home health
34.5%
of home health referrals accepted in 2024
-1.3%
Medicare home health payment change for 2026
Executive summary
Home health has more patients than it can serve and fewer clinicians than it needs. The constraint on growth is no longer referrals. It is the number of nurses and therapists who stay long enough to take a full caseload.
1. You lose about one RN in four every year. Home health RN turnover was 25.46% in 2025, compared with 17.6% for hospital RNs.
2. Most of that loss happens early. In one study, 34% of new full-time home health nurses and 45% of part-time nurses left in their first year, most within 180 days.
3. Unfilled seats are turning patients away. Home health referral acceptance was 34.5% in 2024, even as referrals rose 6%. In Texas alone, 34 agencies declined 6,625 patients in a year for lack of staff.
4. You cannot simply pay your way out. Medicare cut aggregate home health payments 1.3% for 2026, and MedPAC has recommended a further 7% cut to the base rate. All-payer margins for freestanding agencies were 5.0% in 2024.
5. The biggest lever is one most agencies already control: the schedule. Full-time RNs with the most volatile schedules were 50% more likely to quit. Those with the most stable schedules were 40% less likely.
Our view: retention in home health is a capacity strategy, not an HR program. Every clinician you keep is a caseload you can staff, a referral you can accept and a start of care you can make on time. This playbook shows where clinicians leave, what it costs, what each executive sees, and what to do in the next 90 days.
The state of the home health workforce
Turnover is high, and it starts early
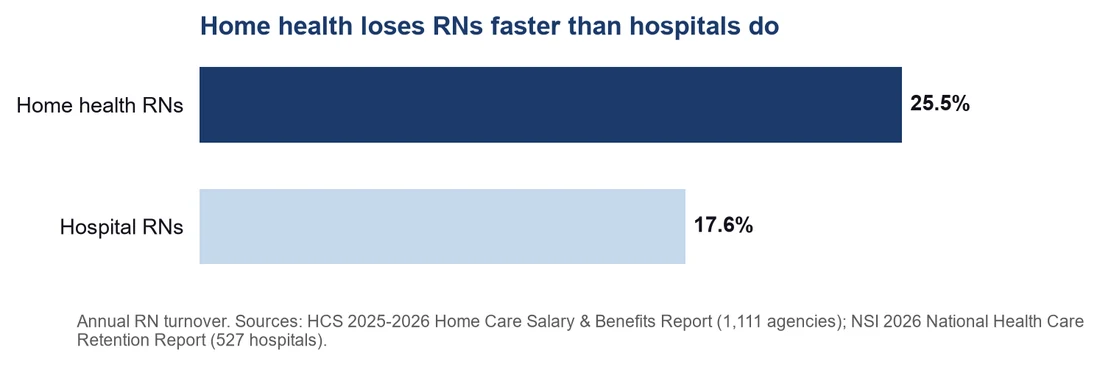
The Hospital and Healthcare Compensation Service surveyed 1,111 home health agencies for its 2025-2026 report. RN turnover improved slightly, from 26.95% to 25.46%, and 36.52% of agencies said turnover fell in the past year. That still means a typical agency replaces a quarter of its RNs every year, at a time when the average RN sign-on bonus has reached $7,499.
Even the largest operators feel it. Amedisys, one of the biggest home health companies in the country, reported voluntary turnover between 16.8% and 20.5% each quarter of 2024 in its SEC filings.
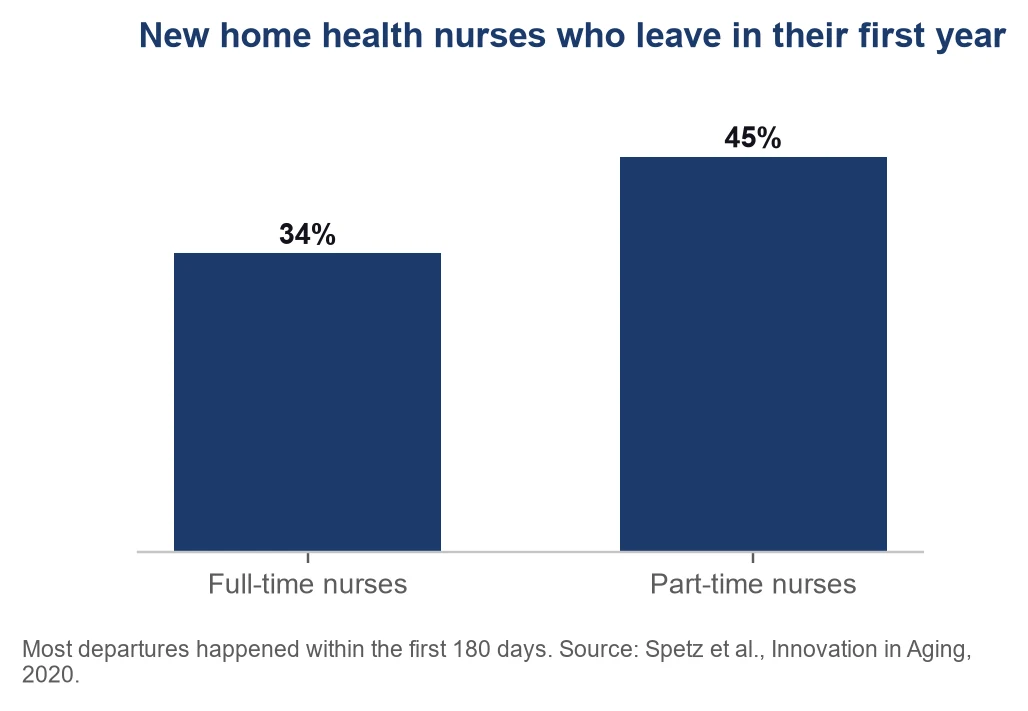
The first six months decide most of it. When researchers followed home health nurses at a large agency, a third of new full-time nurses and nearly half of part-time nurses were gone within a year. Voluntary departures outnumbered involuntary ones almost four to one. These are not people being let go. They are people choosing to leave.
The money is getting tighter
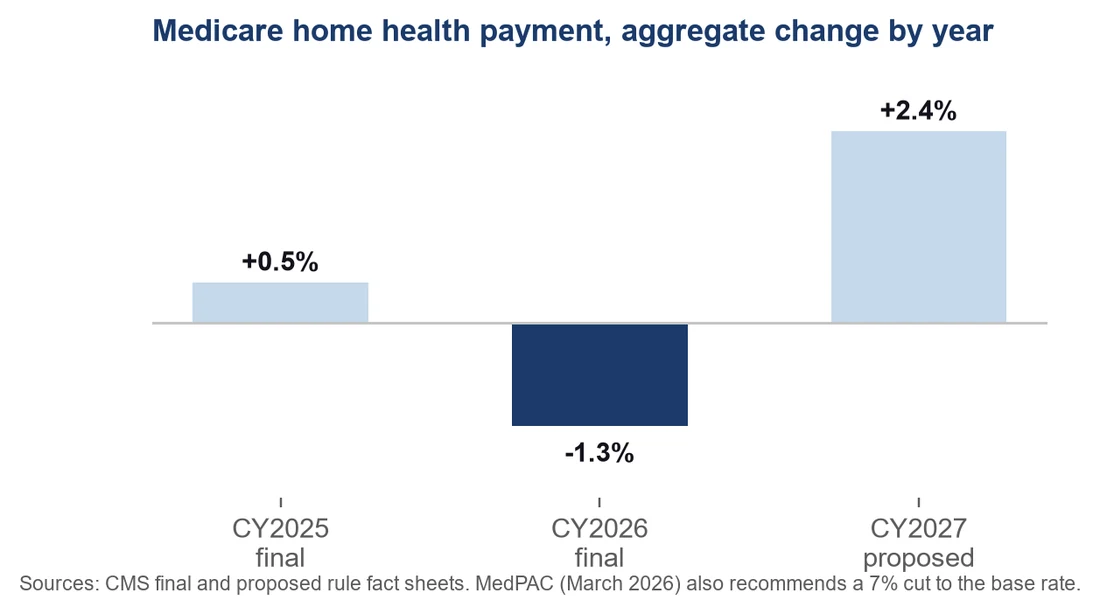
CMS finalized a 1.3% aggregate cut to Medicare home health payments for 2026, about $220 million. For 2027, CMS has proposed a 2.4% aggregate increase that still includes a 3.0% temporary cut to the rate. MedPAC voted unanimously in March 2026 to recommend Congress cut the base rate 7%. Medicare margins look healthy on paper, at 21.2% for freestanding agencies in 2024, but all-payer margins were only 5.0%.
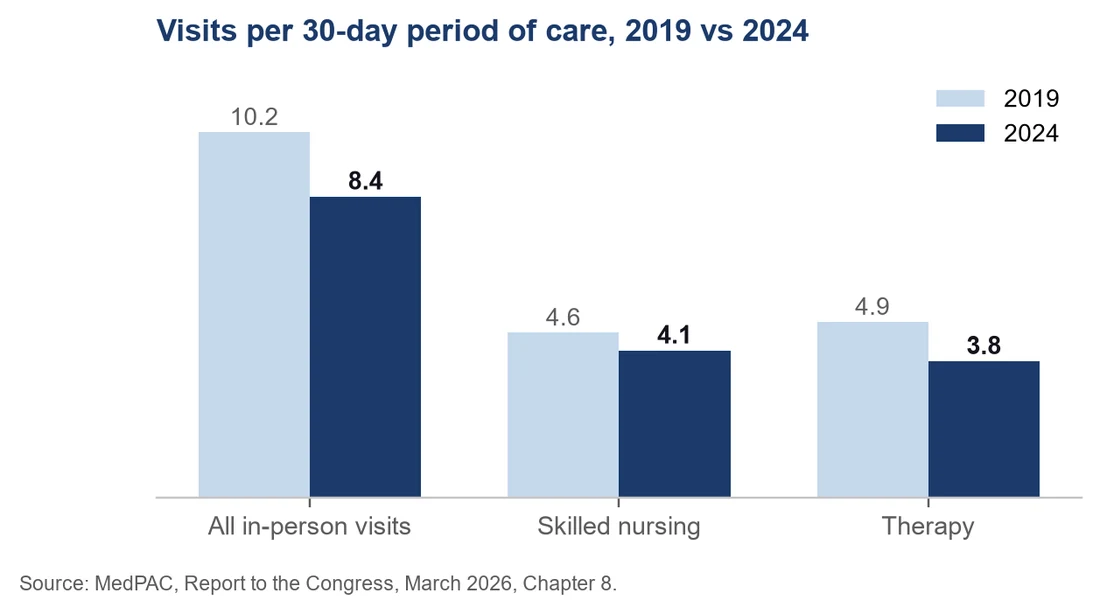
Care is also being delivered with fewer visits. In-person visits per 30-day period fell 18% from 2019 to 2024. Therapy visits fell 21.5%. Each visit carries more weight, and each clinician you lose takes a bigger share of your capacity with them.
Outside California, the number of Medicare-certified agencies fell from 9,823 to 9,320 between 2019 and 2024. The market is consolidating. Agencies that can staff will take share from agencies that cannot.
Your RN competitor is the hospital
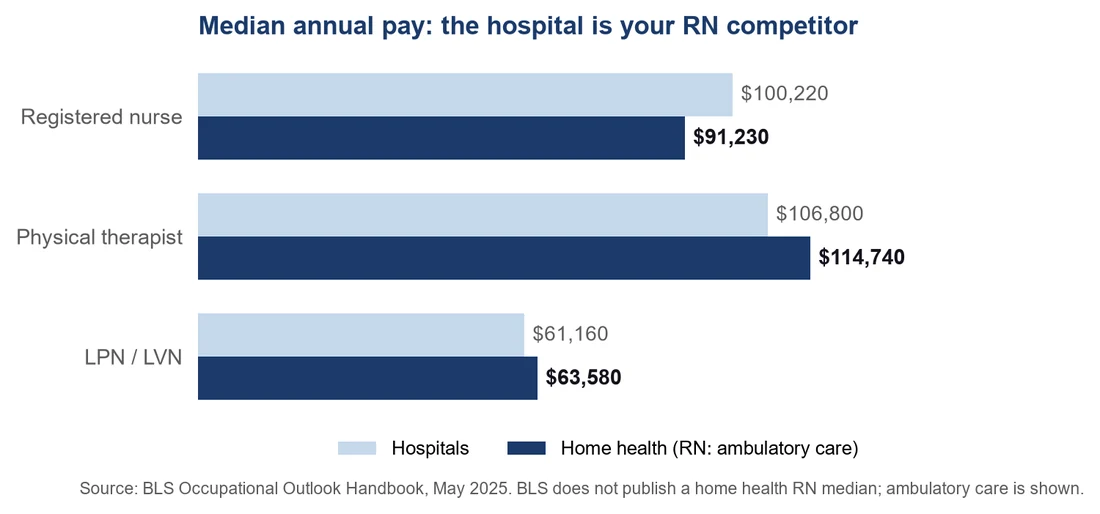
Home health already pays therapists and LPNs more than hospitals do. The median physical therapist in home health earns $114,740, compared with $106,800 in hospitals. RNs are different. The hospital median is $100,220, and travel nurses average about $91 an hour. That is the gap your recruiters are fighting, and it is why pay alone rarely wins the retention battle for RNs.
What industry leaders are saying
Our assessment: why clinicians really leave
Pay matters, and it gets most of the attention. In our experience, and in the research, it is rarely the first thing that pushes a clinician out the door. These are the six forces we look for first.
1. The schedule is the job. A clinician's week is set by a scheduler they may never meet. When visit counts swing week to week, pay swings and family plans fall apart. The research is clear: schedule volatility predicts quitting more strongly than almost anything else an agency controls.
2. The first 180 days decide it. Orientation, field shadowing and the first solo caseload are where most clinicians are lost. A new nurse who feels thrown into the car alone with a full caseload starts looking within weeks.
3. Charting is a second shift. Documentation follows clinicians home. The 2025 ASHA survey found one in three home health speech-language pathologists works off the clock every day. Research links documentation burden and visit pressure to burnout and intent to leave.
4. The manager is in the office. The clinician is in the field. Clinical managers often have large teams spread across long drive times. Field clinicians can go weeks without a real conversation with their manager. Isolation is built into the job unless the agency designs against it.
5. The hospital is always hiring. RNs can usually earn more in a hospital or through travel work. You will not always win on pay. You can win on schedule, support and how it feels to work for you.
6. Every loss lands on someone else. When one clinician leaves, the remaining team absorbs the visits. Overtime, longer days and missed visits raise everyone else's risk. Turnover spreads.
This is not a criticism of home health leaders. Most of these forces come from how the work is built, not from bad intentions. That is good news. What is built can be rebuilt.
We have done this with licensed clinicians
Before founding EIP, I spent 20 years in operations and patient experience at a Fortune 10 company. When a new competitor opened a large facility in our market, my region lost 72 of its 348 pharmacists in six months. Many took pay cuts of up to 15% to leave. We stopped guessing, asked the clinicians who stayed what would make the job workable, and fixed it. Pharmacist turnover fell from 42% to 18% within about three months of the changes, and later as low as 9%.
In another part of the company, I led patient experience strategy. Over two years, by improving the employee experience and the patient experience together, our Net Promoter Score went from 24 to 81. Licensed clinicians are not a different species. They leave for the same reasons everyone else does, and they stay for the same reasons too.
What each executive sees
The same turnover number looks different from every seat at the leadership table. A retention plan only works when all of them see the whole picture.
| Role | What they see as the problem | The impact on the business |
|---|---|---|
| CEO | We have referrals we cannot staff. Growth has stalled even though demand is there. | Declined referrals, lost market share to agencies that can staff, and a growth plan that depends on hiring faster than you lose people. |
| CFO | Labor cost per visit keeps rising. Sign-on bonuses, overtime and agency staff are eating the margin. | With all-payer margins near 5% and Medicare cuts, every departure is paid for out of a thin margin. |
| COO | Schedules break every week. Missed visits and late starts of care. | Lower visit capacity, delayed starts of care, overtime on the clinicians who stay, and rising risk that they leave too. |
| CHRO | We cannot hire fast enough to replace who we lose. Exit interviews say pay. | Recruiting runs as a treadmill. Bonuses pull in new hires who leave inside a year, and the real reasons stay hidden. |
| Chief Clinical Officer | New clinicians are not ready for a solo caseload. Tenured preceptors are burning out. | Quality and documentation risk, survey and compliance exposure, and the loss of the experienced clinicians who train everyone else. |
The clinician journey: where people leave
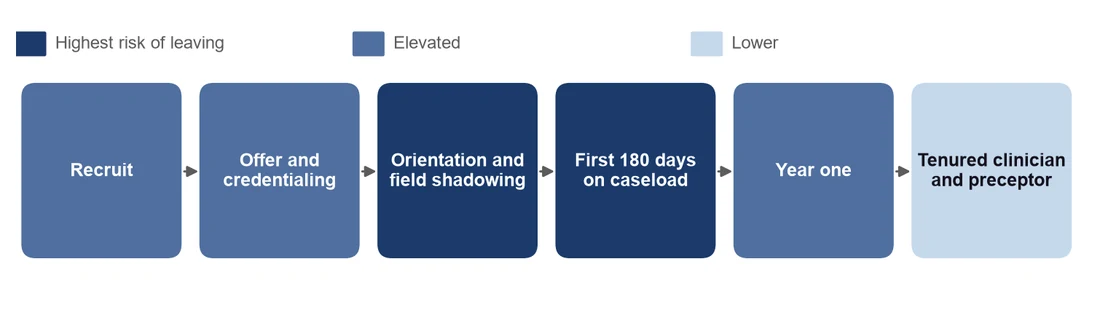
Every clinician moves through the same six stages. Each stage has a predictable point of failure, a warning sign you can see in data you already have, and a fix.
| Stage | What goes wrong | The warning sign | What to do |
|---|---|---|---|
| Recruit | The posting sells flexibility. The job is a full caseload with on-call. | Offer declines and early no-shows | Describe the real schedule, caseload and on-call in the posting and the interview. |
| Offer and credentialing | Weeks of paperwork while a hospital makes a faster offer. | Long gap from offer to start | Cut the time from yes to day one. Every week of waiting is a week another offer can arrive. |
| Orientation and shadowing | Too little field time with a strong preceptor. Too much classroom. | Low preceptor hours, early absences | Pair every new clinician with a trained preceptor and a written plan for the first 30 days. |
| First 180 days | Solo caseload too fast. Volatile schedule. Charting at night. | Schedule swings, late documentation, quiet in case conference | Ramp the caseload, protect a stable schedule and hold weekly manager check-ins. |
| Year one | Pay falls behind the hospital. No visible path. Sign-on bonus ends. | Bonus end dates, no review, no raise | Hold a pay and career conversation before the bonus ends, not after. |
| Tenured and preceptor | Carries the hardest cases and trains everyone. Burns out. | Rising overtime and caseload, teammates leaving | Recognize and pay for precepting. Protect your best people from carrying the gaps. |
What a clinician departure really costs
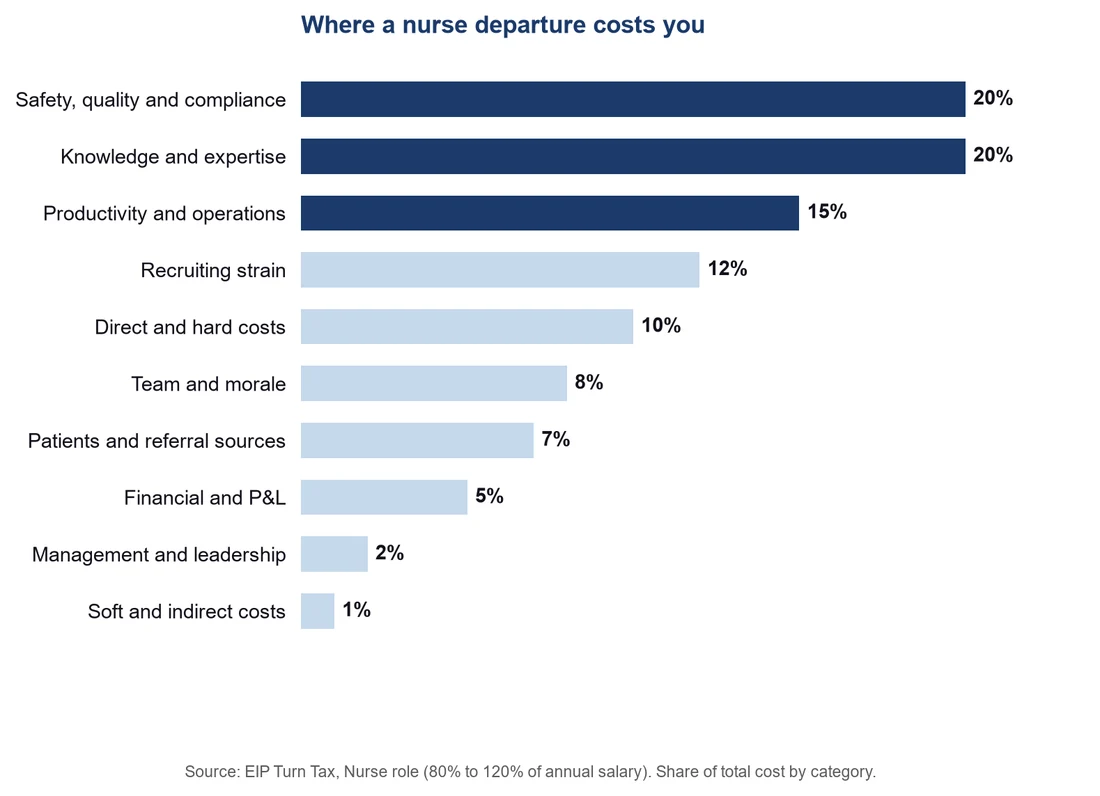
EIP's Turn Tax™ builds the cost of turnover from the ground up across 13 categories and up to 250 variables. For nurses, the cost runs from about 80% to 120% of annual salary. The largest pieces are not recruiting fees. They are safety and compliance risk, and the clinical knowledge that walks out the door.
For comparison, the 2026 NSI report puts the average cost of replacing a hospital bedside RN at $60,090, with 78 days to recruit an experienced RN. Our number also counts what happens to your patients, your referral sources and the clinicians who stay.
The signals we read in home health
The Flight Risk Score™ (patent pending) scores each clinician from 0 to 99 for the next 90 days using data most agencies already have in scheduling, EMR and payroll systems. It reads four areas. In home health, they look like this.
| Area | What it looks like in home health |
|---|---|
| Manager relationship | Clinical manager changes, how often the clinician actually talks with their manager, case conference participation, and teammates leaving the same branch. |
| Career and tenure | Days since start, especially inside the first 180 days. Time since last review. Whether they are a preceptor, and whether they have a path to a new role or credential. |
| Pay | Pay against local hospital and agency rates, the last raise, a change from per-visit to salaried pay or back, and sign-on bonus end dates. |
| Job friction | Week-to-week swings in visit counts, documentation completed late or after hours, drive time, on-call frequency, unplanned absences and missed visits. |
We weight the four areas for each agency and test the model against the clinicians who have already left before anyone acts on it. Then the score becomes a short list for each manager: who to talk to this week, and what to raise.
| Score | Band | What to do |
|---|---|---|
| 0 to 40 | Low risk | No immediate action needed. |
| 41 to 60 | Worth watching | Flag for a check-in conversation. |
| 61 to 80 | Intervention needed | Have a direct conversation now. |
| 81 to 99 | Critical | This person is likely already looking. Talk this week. |
How EIP fixes clinician turnover
1. Free test. Send one spreadsheet for one to three job titles that share a pay band, a geography and the same kind of work. Field nurses and therapists can be combined. Field clinicians and office staff cannot. Names are replaced with codes. See your first Flight Risk Score and Turn Tax numbers in about 7 days, for a small group, with no contract.
2. 30-day diagnostic. We find where and why clinicians leave: by branch, by manager, by stage of the journey. Honest Read™ interviews and small listening sessions with your tenured clinicians tell us what the data cannot.
3. The Council decides what to fix. Our Council of current and former executives and operators reviews the findings and chooses the best-fit fixes before anything is recommended. Most cost nothing extra.
4. We fix it with you. Scheduling stability, preceptor programs, manager check-ins, documentation time, pay conversations before bonuses end. We stay through the work.
5. We track it every month. Council View shows the numbers that predict departure, branch by branch, and we review them with you monthly.
You are not buying software. You are buying retention support, from operators who have run this playbook with licensed clinicians.
Your first 90 days
| When | What to do |
|---|---|
| Weeks 1 and 2 | Price the problem. Calculate the Turn Tax for your field RNs and therapists. Count the referrals you declined last quarter for lack of staff. |
| Weeks 3 and 4 | Find where people leave. Pull every clinician departure from the last 24 months by branch, manager and days since start. Look hard at the first 180 days. |
| Weeks 5 and 6 | Listen. Ask your ten longest-tenured clinicians: if you had no money but could fix one thing, what would it be? Fix the free answers first. |
| Weeks 7 to 10 | Stabilize the schedule. Measure week-to-week swings in visits for every full-time clinician. Set a target and hold schedulers to it. |
| Weeks 11 and 12 | Build the loop. Weekly manager check-ins for new clinicians, a named preceptor for every hire, and a monthly review of who needs a conversation. |
Start with a conversation
If you lead a home health agency and want to know who is at risk, what turnover is costing you and what to fix first, start with a free test. One spreadsheet, one to three field clinician titles, a small group, and first numbers in about 7 days.
eip360.com | [email protected]
Sources
Hospital & Healthcare Compensation Service (HCS). 2025-2026 Home Care Salary & Benefits Report, press release, November 2025. Supported by the National Alliance for Care at Home and LeadingAge.
NSI Nursing Solutions. 2026 National Health Care Retention & RN Staffing Report, March 2026.
Spetz, J., Bergman, A., Song, H., Rose, R., David, G. "Understanding Nursing Turnover: The Case of Home Health Care." Innovation in Aging, 2020.
Bergman, A., Song, H., David, G., Spetz, J., Candon, M. Medical Care Research and Review, 2021. Summary: Penn LDI, "Smarter Scheduling in Home Health Care," August 2021.
Centers for Medicare & Medicaid Services. CY2026 Home Health Prospective Payment System Final Rule fact sheet (November 2025) and CY2027 Proposed Rule fact sheet (July 2026).
Medicare Payment Advisory Commission (MedPAC). Report to the Congress, March 2026, Chapter 8: Home health care services.
U.S. Bureau of Labor Statistics. Occupational Outlook Handbook: Registered Nurses, Licensed Practical and Licensed Vocational Nurses, Physical Therapists. May 2025 wage data.
Texas Department of State Health Services. 2024 Home Health and Hospice Care Nurse Staffing Study, February 2025.
American Speech-Language-Hearing Association. 2025 SLP Health Care Survey.
Amedisys therapy staffing mix: Q4 2024 earnings supplemental slides, SEC filing.
Amedisys, Inc. Quarterly earnings supplemental slides, 2024, filed with the SEC.
Home Health Care News: WellSky referral data (October 10, 2024); 2026 home health forecast (January 5, 2026); Enhabit CEO interview (August 13, 2025); home care job openings (September 23, 2025).
EIP Turn Tax matrix, Nurse role. Worked example is illustrative. EIP stories are from the author's own career at a Fortune 10 company; names, places and identifying details are withheld.
More playbooks on the shelf.