
White papers
Read the book, one chapter at a time.
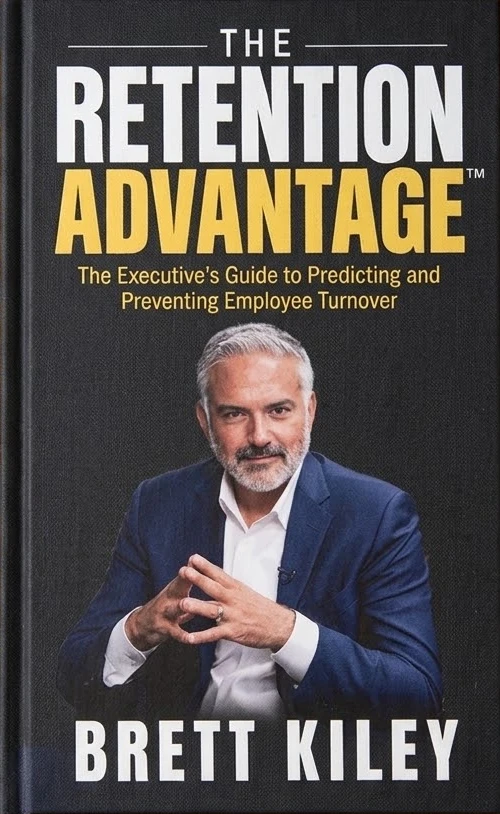
Each white paper is a chapter from Brett Kiley's upcoming book, The Retention Advantage, expected in Summer 2027. Free to read, free to download.
Expected Summer 2027
Plain text
Read the chapters as text.
No. 2 · DraftIt Was Never the MoneyWhy exit interviews produce polite fiction, and what to ask instead
Brett Kiley, Founder and CEO, Experience Improvement Partners | October 2026
The ritual
It is someone's last day. They have turned in their badge. The new job starts Monday.
An HR coordinator asks why they decided to leave. They say it was a better opportunity. The commute. A little more money.
None of that is the real answer. The real answer is a supervisor who only spoke to them to point out mistakes in front of the team. An equipment request submitted three times with no reply. A question about a lead role that got brushed off.
They will not say that. They might need a reference someday. So they give a clean story nobody can argue with. The coordinator types "compensation" into the form, and it becomes data.
The exit interview is a ritual, not a research method. It asks someone who has already decided, already signed somewhere else and has every reason to stay polite. Pay is the most socially acceptable exit story there is. It names a need without blaming anyone.
What the research says
75%
of departures were preventable (Work Institute, 2025)
45%
of people who quit had no conversation about their future in the 3 months before quitting (Gallup)
17%
of people who quit were asked what would keep them (Gallup)
Work Institute analyzed more than 120,000 exit interviews for its 2025 Retention Report. It found that 75% of departures were preventable, and it pointed to leadership, culture and career development as the levers. Those interviews were run by a neutral third party, not the employer. That matters. People tell an outsider what they will not tell the company they are leaving.
Gallup's 2024 study of people who quit found that 42% said their manager or organization could have prevented it. Then it asked what happened before they left. 45% said no manager or leader talked with them about their satisfaction, performance or future in the three months before they quit. Only 17% were asked what would keep them. 36% did not talk to anyone at work before resigning.
Pay does matter. In Gallup's data, better pay or benefits was the most common thing that could have prevented a departure, at 30%. But that means about 70% of preventable exits needed something else: a better relationship with a manager, a fix to an organizational problem, a path to advance, or a workload that made sense.
Read those numbers together. Most people who leave could have been kept. Most were never asked. And when the answer is pay, it is usually one reason among several, not the only one.
What I learned in 20 years of operations
Before I founded EIP, I spent 20 years leading operations and employee experience at a Fortune 10 company. Two stories from that time changed how I think about exit data.
The Amazon story that was not true
A distribution center that supplied my stores was a full day behind on trucks. It did not have enough people. Stores I was responsible for had 12 feet of empty shelving. Turnover at the center was 97%.
The explanation everyone repeated was Amazon. Amazon was hiring nearby and paying more. The exit data seemed to agree.
So we skipped the exit interviews and asked a different source. We asked employees who were still there where their friends had gone. Of the last 30 people who left, only 2 went to Amazon.
The real causes were inside the building. The hiring pitch promised a family culture. Day one was mandatory Saturday overtime. Managers were so short-staffed they were working the line themselves, with no time left to check in on anyone. Half of the people with more than a year of tenure had not had a raise, while new hires with sign-on bonuses could out-earn them. Without meaning to, we had built a system where quitting and getting rehired paid better than staying.
We ran stay interviews with the people who were still there, then fixed what they told us. Turnover fell from 97% to 51% in three months.
Pharmacists who took a pay cut to leave
When a new competitor opened a large facility in our market, my region lost 72 of its 348 pharmacists in six months. Many took pay cuts of up to 15% to leave. They would not come back even when offered raises.
If pay were the real reason, a raise would have worked. It did not. They left for working conditions. Our annual engagement survey had flagged "not enough tools and resources," and the natural read was that people needed better technology. The real cause was that many stores had lost their lead technician role. After we rolled out fixes, pharmacist turnover fell to 18% within about three months, then went as low as 9%.
In both cases, the exit story pointed at someone else. Amazon. A competitor. Money. The causes we could actually fix were inside our own walls. The people who were still there knew exactly what they were, and once we asked, they helped us fix them.
Where the real decision happens
Every resignation has three layers.
1. The result. Someone quits. This is what the exit interview studies.
2. The behavior. Before that, they start applying elsewhere, taking calls, leaving right at five and going quiet in meetings.
3. The thinking. Before that, the real decision forms: I do not have a future here. Nobody is going to fix this. I deserve better.
Most companies only manage the result. They react to resignations, run exit interviews and make counteroffers. By the time the letter arrives, the thinking is usually weeks or months old. The window to change it was open, and nobody walked through it.
The resignation letter is not the event. It is the receipt.
What to do instead
1. Ask the people who are still here. Run stay interviews with your current team, starting with the people you can least afford to lose. Use four questions: What makes you come back here every day? What would make this job better? Is anything frustrating you that we have not addressed? What would it take for you to still be here a year from now?
2. Do something within two weeks, and say so. Every stay interview should produce one specific action with a date. When it is done, tell the person. A conversation with no follow-through teaches people that honesty produces nothing.
3. Find out where your former employees actually went. Track where your last 12 voluntary departures landed. If three or more went to the same place, you have a competitive pattern. If they scattered, the cause is probably inside your walls.
4. If you keep exit interviews, change the question. "Why are you leaving?" invites the clean story. "What would it take to get you back?" goes straight to the conditions, because it is about the future, not blame. Use a neutral third party if you can.
5. Talk before the 90-day window closes. Gallup found that 77% of people who quit either left within three months of starting to look or never actively looked at all. If the first real conversation happens after the notice, it is too late.
How EIP helps
Exit data tells you why people say they left. EIP finds out who needs a conversation now, and why.
Flight Risk Score™ (patent pending) scores each employee from 0 to 99 for the next 90 days, using HR data you already have. It flags who needs a conversation and what to raise. No surveys and no integration.
Honest Read™ gets the answers employees will not put in an exit interview, through stay interviews and small listening sessions run by people outside your chain of command.
Our Council of current and former executives reviews the findings before anything is recommended. Then we stay with you through the fix.
Start with a conversation: eip360.com | [email protected]
Sources
Work Institute. 2025 Retention Report. March 2025. workinstitute.com
Tatel, C. and Wigert, B. "42% of Employee Turnover Is Preventable but Often Ignored." Gallup, July 9, 2024, updated February 16, 2026. gallup.com/workplace/646538
Stories are from the author's own career at a Fortune 10 company. Names, places and identifying details are withheld.
No. 4 · DraftThe Survey That Measured FearWhy your annual engagement survey hears the wrong people, and what to ask instead
Brett Kiley, Founder and CEO, Experience Improvement Partners | October 2026
The ritual
It is September. There is cake in the break room. It is the only month all year with birthday cake.
There is a bowl of candy bars on the table. The boss calls to say thank you for your hard work. It is the only recognition call you get all year, and it comes the week before the survey launches.
The email goes out. Subject line: we value your feedback. All responses are anonymous.
Everyone on the floor knows how this works. People call it "five to stay alive." On a one-to-five scale, a five is invisible. A two gets traced back to you.
Results come back weeks later in a beautiful slide deck. Scores are up two points from last year. Leadership celebrates. A town hall gets scheduled.
Meanwhile, 40% of the team will quit this year. The survey score and the turnover number do not move together. They are not measuring the same thing.
The survey hears the wrong voices
Every survey assumes the answers represent your workforce. They do not. Three groups answer in three very different ways.
1. Your long-tenured people check out. They have taken this survey every year. They have watched nothing change. So why bother? They mark it down the middle, or skip it, and they leave the comment box empty.
2. Your new people play it safe. They are generally happy, and they fill it out. But they are just starting their careers and they do not believe it is anonymous. They are not going to risk being honest.
3. Your unhappy people unload. Someone who already has one foot out the door has a lot to say, and the comment box is their chance to say it.
Now aggregate the comments. They skew toward unhappy people and new people. The voice you are missing is the one that matters most: the happy, long-tenured, high performers who know how the work actually gets done.
And every answer counts the same. Your top performer's score weighs exactly as much as the score of someone who is already planning to leave. A better approach is to look at engagement next to performance, so you know whose experience you are actually measuring.
Anonymous is a promise employees do not believe
Most surveys require a login with an employee ID or email. That makes them confidential, not anonymous. The vendor knows who said what. Employees understand the difference, even when nobody explains it.
Small teams make it worse. If your manager is the problem and your team has six people, you are not going to write that down. Your manager reads the comments. It would not be hard to figure out who wrote them.
So people disguise their writing. They skip capital letters they would normally use. They avoid words they normally say. Think about that. Your employees are working to hide their own voice from the survey that claims to want it.
The participation rate is not what it looks like
Survey programs love to report 80% participation. Here is how that number often gets made.
1. There is a list of names. Managers get a report of who has not taken the survey yet: go talk to these 10 people.
2. People get called in. Not taking the survey becomes a performance conversation.
3. Some managers watch. Some managers have sat in the office and watched the screen while an employee filled it out.
By the time a pressured employee finally takes the survey, they are annoyed. How honest do you think that answer is?
All that pressure produces good-looking results. Everyone can celebrate the two-point gain. It does not mean anyone is more likely to stay.
Where the feedback goes to die
Even honest feedback has a long trip to make. A frontline employee with a great idea can be ten steps away from anyone who can act on it. Every step is a filter.
Leaders at the top cannot read thousands of comments, so someone summarizes them. That summary is another filter. By the time an idea reaches a decision maker, it has been smoothed into a theme on a slide.
The vendors know this. A few years ago the big survey companies realized many clients were not using their reports at all. Companies paid for the survey, received the deck, printed it, put it on a desk, and never held a follow-up meeting.
Perceptyx's 2026 State of Employee Listening research puts numbers on the gap. 71% of employees said their organization shares survey results. 59% said action plans are created. Only 51% said the feedback led to any actual improvement.
No action is worse than no survey. When you ask for someone's opinion and nothing visible happens, you teach them that speaking up is a waste of time. Next year, they answer accordingly.
Why companies keep doing it anyway
When I stopped leaning on our annual survey, I got pushback. Some of it was fair. All of it was predictable.
1. It costs a lot, so it has to work. We were spending more than $1 million a year on the survey. When you spend that much, people want to see year-over-year improvement.
2. Leaders were bonused on the score. The number became the goal, even though it did not tie to turnover, customer results or anything else we were trying to fix.
3. Everyone else does it. Most large companies run an annual survey. Nobody wants to be the one that stopped.
4. It feels like action. Running a survey feels like listening, even when nothing changes afterward.
What we did instead: magic wand interviews
Before I founded EIP, I spent 20 years in operations at a Fortune 10 company. On my teams, we replaced most of our reliance on the survey with conversations. Most people call them stay interviews. We called them magic wand interviews, because of the first question.
The "no money" answers were gold. They were problems we could fix quickly, without waiting for budget or corporate approval. So we fixed them, and we told people we did.
Small fixes, big impact
1. Meeting times. We moved meetings to different times of day, because people had to pick up their kids.
2. Recognition. We changed how we recognized people, including recognizing them publicly, not just once a year.
3. Report colors. Our reports were designed in color, but the printers were black and white. Printed out, every line looked the same. We fixed the colors.
Some of these sound almost silly. That is the point. They cost nothing, they were fast, and they proved that someone was listening.
72 to 81
engagement score on my teams
#1
in the division, and the most improved
The score went up because we stopped chasing the score. We fixed what people told us, in person, and closed the loop.
What to do instead
1. Decide before you survey. If you are not prepared to act on what you hear within 30 days and tell people what you did, do not ask.
2. Run magic wand interviews. Start with your long-tenured high performers, the voices your survey is missing. Ask the no-money question every time.
3. Fix the free things first. The no-money list is your quick-win list. Most of it needs a decision, not a budget.
4. Close the loop by name. Tell the people who raised it what you did. Not a company-wide memo. A conversation.
5. Stop paying leaders for the score. Tie incentives to outcomes like retention of your best people, not to survey points.
6. Read the score next to turnover. If engagement is up and your best people are still leaving, believe the turnover number.
How EIP helps
You may be able to stop paying for an annual survey that tells you what happened last year.
Honest Read™ gets the answers employees will not put in a survey, through interviews and small listening sessions run outside your chain of command. Then it helps you close the loop.
Flight Risk Score™ (patent pending) uses HR data you already have to show who needs a conversation now, and what to raise. No surveys and no integration.
Our Council of current and former executives reviews the findings before anything is recommended. Then we stay with you through the fix.
Start with a conversation: eip360.com | [email protected]
Sources
Ewen, L. "HR workload remains a top barrier to listening program success, report says." HR Dive, March 31, 2026, reporting Perceptyx's State of Employee Listening research. hrdive.com
Stories are from the author's own career at a Fortune 10 company. Names, places and identifying details are withheld.
No. 5 · DraftThe Tax You Never SeeWhat turnover really costs, and why your HR report only shows the tip
Brett Kiley, Founder and CEO, Experience Improvement Partners | October 2026
Gone before the first call
Every year we hired about 2,000 people for our busiest season. We recruited them from August through December, most of them in October and November. We screened them, ran background checks and drug tests, did the paperwork and trained them for weeks.
Day one was January 1. Trained, in a seat and taking calls.
42% of them never made it to day one.
That is roughly 840 people we paid to find, hire and train, who left before they helped a single customer. None of that showed up anywhere as "turnover cost." It was spread across recruiting budgets, training budgets, overtime and temp labor. Each line looked normal on its own.
The next year, we redesigned how we hired. We shortened the process and added new filters and screening questions, so the people we hired were the people likely to stay. The number dropped to 15%. That was about 540 more trained people in a seat on January 1.
Nobody had ever added it up. That is the problem with turnover cost. It is real, it is large, and it is invisible by default. You have to calculate it on purpose.
The tip of the iceberg
A recruiting fee is like the tip of an iceberg. It is the part you can see. Productivity loss, manager time and new hire mistakes are the ninety percent hiding underwater.
Ask most companies what turnover costs and they will add up job ads, agency fees and background checks. Those are real. They are also the smallest part.
What sits underwater
1. The slowdown before they leave. People who are planning to go do not work at full speed in their last weeks or months. They are on the roster. They are not fully there.
2. The empty seat. Someone covers it with overtime, temp labor or a supervisor doing two jobs. The cost lands in four different budget lines, and none of them is labeled turnover.
3. The manager's time. Every interview, every onboarding session and every hour spent covering the gap is time a manager is not running the operation.
4. The new person's learning curve. A replacement takes weeks or months to reach full speed, and makes the mistakes the last person already learned to avoid.
5. The knowledge that walks out. Workarounds, customer relationships and how things actually get done. None of it is written down.
6. The customer. In service work, customers feel turnover first, in errors, wait times and unfamiliar faces.
Phantom staffing
Sometimes the report does not just miss the cost. It hides the problem entirely.
During COVID, call-offs at my company were paid but carried no tracking code. On paper, our stores looked close to fully staffed. So my team built its own report of who actually showed up and how long they worked. The real staffing level was far lower than what corporate saw.
Because the people were still on the roster, nobody upstream saw a turnover or retention problem at all. Eventually a code was added. By then the damage was done.
Thirteen places the cost hides
EIP's Turn Tax™ builds the cost from the ground up across 13 categories and up to 250 variables.
| Category | What it includes |
|---|---|
| 1. Direct and hard costs | Job postings, agency fees, background checks, onboarding admin |
| 2. Soft and indirect costs | HR time, manager interviews, internal coordination |
| 3. Productivity and operations | Output lost while the role is vacant or ramping up |
| 4. Knowledge and expertise | Institutional knowledge, client relationships, process know-how |
| 5. Team and morale | Engagement drop and burnout on the people who stay |
| 6. Customers and clients | Service disruption, relationship risk, revenue exposure |
| 7. Safety, quality and compliance | Coverage gaps, error rates, regulatory exposure |
| 8. Financial and P&L | Overtime, budget overruns, revenue tied to the vacancy |
| 9. Strategy and competition | Delayed initiatives, competitive disadvantage |
| 10. Management and leadership | Executive time diverted to coverage and replacement |
| 11. Recruiting strain | Pipeline pressure, sourcing effort, offer negotiation |
| 12. Technology and systems | Access changes, licenses, system knowledge lost |
| 13. External reputation | Employer brand, review sites, candidate perception |
What the research says it costs
16% to 213%
of salary, from frontline to executive (Center for American Progress)
Up to 2x
annual salary to replace one employee (Gallup)
Gallup estimates that replacing an employee costs one-half to two times their annual salary, and calls that conservative. By that math, a 100-person company with an average salary of $50,000 could be paying $660,000 to $2.6 million a year in turnover and replacement costs.
The Center for American Progress reviewed 30 case studies and found a typical cost of about 16% of salary for jobs paying under $30,000 a year, and up to 213% for senior and executive roles. Their numbers are lower at the frontline because many studies only counted direct costs.
That spread is the point. Depending on the role and what you count, the answer swings by ten times. A national average cannot tell you what turnover costs your company. Only your own numbers can.
This is how Turn Tax prices it, before we customize it to your actual data:
1. Frontline roles: about 25% to 55% of annual salary per departure.
2. Specialized and technical roles: about 45% to 120%.
3. Executives: about 150% to 213%.
What it looked like when I did the math
When I added up my own results from 20 years in operations at a Fortune 10 company, I used the most conservative version I could defend in front of a CFO.
1. Count the people who stayed. Across my region, a distribution center and the seasonal hiring program, about 2,100 people a year stayed who, at the old turnover rates, would have left.
2. Use real pay. Real wages for each group: store associates, pharmacy staff, pharmacists, district leaders, warehouse workers and call center agents.
3. Use the low end of every range. And for the seasonal hires who left during training, count only recruiting, training and admin, because they left before we lost any customers or knowledge.
2,100
people a year who stayed
$18 million+
a year in turnover cost avoided, at the low end
At the midpoint of the same ranges, it was about $31 million a year. I use the $18 million because every input can be rebuilt line by line. That is the kind of number that survives a budget meeting.
Present a recovery, not a cost
Retention programs get deferred when they are presented as a cost: here is what training costs, here is the budget for the initiative. Costs get cut.
Change the first number. Do not lead with what the program costs. Lead with what turnover already costs you every year, and how much of it you can recover.
1. Current Turn Tax: what turnover costs you this year, across all 13 categories.
2. Recovery goal: the share of it you and your partner agree to win back, tracked monthly.
3. Program cost: compared against the recovery, not against other budget lines.
A retention program framed as a cost competes with every other cost. Framed as recovered profit, it competes with almost nothing.
How EIP helps
Turn Tax™ puts a board-ready dollar figure on your turnover, built from your own numbers, by role, across all 13 categories. You get the cost per departure, a three-year projection at your current rate, what any improvement is worth, and where the cost concentrates.
Flight Risk Score™ (patent pending) then shows who is about to cost you next, so you can talk to them first.
Try the calculator free: eip360.com/turn-tax-calculator
Start with a conversation: eip360.com | [email protected]
Sources
McFeely, S. and Wigert, B. "This Fixable Problem Costs U.S. Businesses $1 Trillion." Gallup, March 13, 2019. gallup.com/workplace/247391
Boushey, H. and Glynn, S. J. "There Are Significant Business Costs to Replacing Employees." Center for American Progress, November 16, 2012. americanprogress.org
Stories and results are from the author's own career at a Fortune 10 company. Names, places and identifying details are withheld.
No. 7 · DraftThe Data Already KnewHow a Flight Risk Score finds the people who need a conversation in the next 90 days
Brett Kiley, Founder and CEO, Experience Improvement Partners | October 2026
"Daniel quit last week"
We built a Flight Risk Score for an oil and gas company, from the real data of about 600 people. Some still worked there. Some had already left.
When we presented it to their leadership team, we took every name off the list on purpose. We wanted to show how the score works, not who was on it.
The person at the top of the list scored 82, the highest in the company. All we showed was his region.
Without being asked, the executives started guessing who the top names were. Someone from HR looked at the first row and asked, "Is that Daniel?"
We said yes.
She said, "Daniel quit last week."
The data already knew. The people in that room knew him. They had worked with him for years. The signs were sitting in their own HR file. Nobody had put them together in time.
The resignation is the receipt, not the event
By the time a resignation letter lands, the decision is already made. The letter is the receipt. The event happened earlier, quietly, while everyone was busy.
77%
of people who quit left within 3 months of starting to look, or never looked (Gallup)
45%
had no conversation about their future in the 3 months before quitting (Gallup)
Gallup's 2024 study of people who quit found that most did not run long, visible job searches. 77% either left within three months of starting to look or never actively looked at all. And 45% said no manager or leader talked with them about their satisfaction, performance or future in the three months before they left.
That is the window. It is short, and most companies miss it. Waiting for someone to tell you they are unhappy does not work, because most people never say it out loud.
The signs are already in your data
Every experienced manager has watched someone leave and thought: the signs were there. They usually were. They were just spread across different reports, owned by different people, and never read together.
A Flight Risk Score reads them together. It looks at four areas.
1. Manager relationship. Has their manager changed recently? How often do they actually meet? Are teammates leaving? This area usually carries the most weight, because it is the one a company controls most.
2. Career and tenure. How long they have been in the company and in the role, time since their last promotion, and whether they are near a point where people often decide to stay or go.
3. Pay. Whether pay has kept up with raises, inflation and peers in the same role. Pay rarely causes a departure on its own, but it speeds up every other reason.
4. Job friction. Patterns that show up before people quit: rising unplanned absences, PTO used in small pieces, overtime climbing, training dropping off, and internal job applications.
The original, patent-pending Flight Risk Score uses 19 variables across those four areas. These 19 are the ones most directly tied to resignations in any industry. Most companies already export them.
From there, we tailor it. Across all the sources a company might have, there are about 80 data points from 15 different systems. You do not need all of them. You need the ones that matter for your people.
1. We weight the four areas for each company. A frontline warehouse role and a regional sales leader leave for different reasons, so the weights change.
2. We add a few targeted variables. Usually these come from what we learn in Honest Read™ interviews and listening sessions, and from watching who actually leaves over time.
3. We test it against the people who already left your company before anyone acts on it.
What the bands mean
| Score | Band | What to do |
|---|---|---|
| 0 to 40 | Low risk | No immediate action needed. |
| 41 to 60 | Worth watching | Flag for a check-in conversation. |
| 61 to 80 | Intervention needed | Have a direct conversation now. |
| 81 to 99 | Critical | This person is likely already looking. Talk this week. |
What the score is, and what it is not
A score of 82 does not mean someone is leaving. It means a conversation is overdue.
1. It is a cue to talk. The score ranks who needs attention in the next 90 days. The conversation tells you why.
2. It is not a decision. The score never makes an employment decision about anyone. People do, and the right response to a high score is attention, not action against the employee.
3. Supervisors never see the number. They see who to talk to and what to raise. A score on a screen turns a person into a label. A short list with a reason turns a manager into a better manager.
4. It is a calculation, not a black box. The model is a documented, weighted calculation built by our team. It does not use machine learning or generative AI, and it does not learn from client data.
What to raise, in order
When the score flags someone, the report suggests what to talk about. We list the manager relationship first, then career, then how they feel about the work and their workload, then pay. Pay is real, but it is rarely the first thing to fix, and leading with money teaches people that the way to get attention is to threaten to leave.
Your best people are your biggest risk
It is tempting to assume turnover is a problem with your weakest people. It usually is not.
In my 20 years in operations at a Fortune 10 company, I learned that a high performer is the biggest flight risk you have. High performers have options. Recruiters find them. Competitors know their names. And they rarely complain before they go. They just start answering the calls.
High performers also hide their signals well. They stay professional. Their output holds up longer. What moves first is quieter: a manager who stopped checking in, a promotion that went to someone else, a raise that did not keep pace. Those are exactly the things a Flight Risk Score reads.
What to do when someone is flagged
1. Talk within a week. For anyone in the Critical band, the manager reaches out within a few days. Speed matters more than a perfect script.
2. Make it a real conversation, not an intervention. Do not mention the score. Get coffee. Ask what makes them come back every day, what would make the job better, what is frustrating them, and what it would take for them to still be here a year from now.
3. The manager owns it. HR can support. HR cannot substitute. The relationship being repaired is with the manager.
4. Do not lead with a counteroffer. A high score does not mean they have an offer. Leading with money tells them that threatening to leave is how to get noticed.
5. Do one thing within two weeks, and tell them. Fix something specific they raised. Then close the loop in person. That is what moves the score back down.
How EIP helps
Flight Risk Score™ (patent pending) scores each employee from 0 to 99 for the next 90 days, using HR data you already have. No surveys, no integration and no system access. Names are replaced with codes before analysis.
You get a short list of who needs a conversation and what to raise, reviewed by our Council of current and former executives before anything is recommended. Then we stay with you through the fix.
Try it free. Send one spreadsheet for one role and a small group of employees. See your first numbers in about 7 days. No contract.
Start with a conversation: eip360.com | [email protected]
Sources
Tatel, C. and Wigert, B. "42% of Employee Turnover Is Preventable but Often Ignored." Gallup, July 9, 2024, updated February 16, 2026. gallup.com/workplace/646538
The opening story is from EIP's own work. The company is not named and the employee's name has been changed. Other stories are from the author's career at a Fortune 10 company.
No. 10 · DraftYour Best People Are Your Biggest RiskWhy high performers leave, why the scoreboard often rewards the wrong people, and how to keep the ones you cannot replace
Brett Kiley, Founder and CEO, Experience Improvement Partners | October 2026
The stretch assignment she turned down
Jenna was one of the strongest district leaders I ever worked with. She ran a district in the wealthiest part of the city. Almost no crime, great results, high margins. A bright personality. Everyone, including me, saw her heading to a regional role.
Then a district opened up downtown, in the same city. It was the hardest market we had: shoplifting, gangs and crime. It was the same role, a lateral move, and she would not have had to relocate. We offered her more money and more stock.
I offered it to her as a development move. It would give her exposure to a whole different world of challenges, and we needed to see that she could lead people when things are hard, not just when things are easy.
She asked to think it over. I encouraged her to take it. She declined.
That was her right, and she stayed a strong leader. But it showed me something about our pipeline. We were promoting people on great numbers, and many of those numbers came from easier districts. We almost never tested people in hard conditions before giving them more responsibility.
Around the same time, I won an award for developing the most people to the next level in the division, including the only promotion to the region level that year. I was proud of it. I also learned that getting someone promoted is not the same as them succeeding once they get there.
Make sure the people you promote can lead people the right way, and keep them.
High performers have options
A high performer is the biggest flight risk you have. Not because they are unhappy more often. Because they have more choices when they are.
1. They are easy to find. Their results are visible. Competitors know their names. Recruiters reach them first.
2. They carry more than their share. Research by Ernest O'Boyle and Herman Aguinis across 198 groups and more than 600,000 people found that performance does not follow a bell curve. In most groups, a small number of stars produced a disproportionate share of the results.
3. They do not complain. They leave. They stay professional. Their output holds up. What moves first is quiet: they stop volunteering, start answering recruiter calls, and stop talking about next year.
When one of them leaves, you do not lose one average person. You lose a share of your results, and often the person everyone else was learning from.
When the scoreboard rewards the easy stores
At my company, bonuses, raises and promotions followed store results. On the surface, that sounds fair. In practice, it was not.
Some of our stores were small locations inside other retailers' buildings. They filled about 200 prescriptions a week. A typical store filled about 2,000. Many sat in affluent areas with almost no theft, where customers paid full price. Those stores were profitable almost by default.
Other stores lost 4% of sales to theft. They had bulletproof glass and half the merchandise locked up. They sat in dying strip malls, in neighborhoods where the population was dropping 11% a year. Their targets were the same as everyone else's: last year, plus a little.
Guess who won the awards, the raises and the promotions. The easy-store managers. The saying among leaders was "don't go downtown," because taking a hard store could end your career. And the people promoted from easy stores often could not, or would not, cover the busy ones.
Strength of schedule
My team proposed a fix. Weight performance by how hard the store is, the way college football judges a team by strength of schedule, not just its win-loss record. A team that goes 10 and 2 against the toughest schedule in the country is not worse than a team that goes 11 and 1 against easy opponents.
Leadership decided what we had was good enough. Resources were limited, and they believed those resources were better spent on other priorities. So the old system stayed. The result was the Peter Principle in action: people with great numbers were promoted to their level of incompetence.
Whatever you pay for is the job. If you reward easy results, your best people will learn to avoid hard work, or leave for a company that sees the difference.
Taking the hard market
I once took a tough downtown market. Shoplifting and violence were part of the job. Even the streetlights were not being replaced. The targets were spread evenly across stores, with no adjustment for a strip mall whose anchor stores had closed.
I knew going in that I would probably go two years without a bonus. It could have been a career risk. I took it anyway, and it worked out.
More importantly, it changed how I led. I had come from the suburbs and did not understand how hard those stores were until I lived it. Later, as a leader, I moved suburban managers into tough districts so they could see it firsthand. You cannot fairly judge someone's results until you understand what they are up against.
Promoting your best is not the same as them succeeding
38,843
salespeople studied: the best sellers were most likely to be promoted, and became worse managers
82%
of the time, companies fail to pick the manager candidate with the right talent (Gallup)
Economists Alan Benson, Danielle Li and Kelly Shue studied 38,843 sales workers at 214 companies. The best salespeople were the most likely to be promoted into management. On average, they then performed worse as managers than people promoted with weaker sales numbers. Being great at the job did not predict being great at leading people who do the job.
Gallup has found that companies fail to choose the candidate with the right talent for a manager role 82% of the time.
A promotion that fails costs you twice. You lose a great individual performer, and you gain a struggling manager whose team starts looking for the exit.
How to keep the people you cannot replace
1. Know who they are. Name your top performers by role, today. If you cannot list them, you cannot protect them.
2. Measure difficulty, not just results. Adjust targets and rewards for how hard the job is: volume, theft, staffing, local conditions.
3. Have the career conversation before a recruiter does. Where do they want to go? What would it take to get there? When was the last time you asked?
4. Test people in hard conditions, with support. Before a big promotion, give them a tough assignment and stand behind them while they do it.
5. Promote for leading people, not just for numbers. Ask how their team feels, who they have developed and how many of their people stayed.
6. Reward the hard assignments. If taking the tough store or the tough team can cost someone a bonus, you are teaching your best people to avoid it.
7. Check their pay against the market. High performers know their worth. Recruiters remind them every week.
How EIP helps
Flight Risk Score™ (patent pending) reads the quiet signals high performers give off, like a manager change, a missed promotion or pay that has not kept pace, and flags who needs a conversation in the next 90 days.
Hire Smart™ finds the 3 to 5 traits your best long-tenured people share, so you hire and promote for what actually predicts success.
Our Council of current and former executives reviews the findings before anything is recommended. Then we stay with you through the fix.
Start with a conversation: eip360.com | [email protected]
Sources
Benson, A., Li, D. and Shue, K. "Promotions and the Peter Principle." Quarterly Journal of Economics, 2019. NBER Working Paper 24343.
O'Boyle, E. and Aguinis, H. "The Best and the Rest: Revisiting the Norm of Normality of Individual Performance." Personnel Psychology 65(1), 2012.
Gallup. State of the American Manager. 2015. gallup.com/workplace/231593
Stories are from the author's own career at a Fortune 10 company. Names, places and identifying details are changed or withheld.
No. 16 · DraftThe Manager Is the ProgramWhy retention lives or dies with your managers, and how to hold them accountable without breaking them
Brett Kiley, Founder and CEO, Experience Improvement Partners | October 2026
The leader everyone above him loved
I once watched a Market Vice President who was brilliant at managing upward. His bosses loved him.
Below him, it was a different story. He micromanaged everyone. People complained, through every channel they had. The complaints went nowhere.
The one time someone gave him a low score on the engagement survey, the response was essentially: if you don't want to be here, leave. After that, people stopped giving honest feedback. They learned the lesson he was teaching.
So they left. Good people took pay cuts to move into other industries, just to get away from him. It had nothing to do with the company or the pay. It was him.
He was not the only problem. The system that measured him only on results, and promoted him for managing upward, was the bigger one. Nobody was measuring how many good people he was costing the company.
People leave managers
70%
of the variance in team engagement is driven by the manager (Gallup)
45%
of people who quit had no conversation about their future in the 3 months before leaving (Gallup)
Gallup has found that managers account for at least 70% of the variance in employee engagement scores across business units. If you know who someone's manager is, you can predict a lot about how engaged they are.
In Gallup's 2024 study of people who quit, 45% said no manager or leader talked with them about their satisfaction, performance or future in the three months before they left. When asked what could have kept them, better interactions with their manager was one of the most common answers.
Managers are also the most controllable part of retention. Pay needs budget. Promotions need open roles. A manager who checks in, closes the loop and treats people with respect costs nothing.
What changed when we stopped ranking people publicly
When I took over a struggling region, it was in rough shape. A new competitor had just pulled away many of our pharmacists. Two district managers quit almost right away. Turnover across the region was running at about 61% a year.
Part of the problem was how we measured leaders. Districts were stack-ranked against each other. The bottom of the list got called out publicly. Nobody at the top would share people with a struggling district, because helping someone else could drop you down the rankings. Everyone held on to their own staff, even while stores nearby could not open.
So we ended it. Instead of ranking district against district, we measured our region against other regions. Suddenly every district leader was on the same team.
1. Stores stayed open. Leaders moved people to wherever they were needed most.
2. Talent got shared. Strong districts helped struggling ones instead of protecting their rankings.
3. People stayed. Region turnover fell from 61% to 18% in one year.
Our district leaders felt it too. Turnover among our 24 district leaders had been driven by the stress of constant store-level turnover. It went from about four leaders quitting a year to one.
You cannot manage 35 people
Some of our leaders ended up with about 35 direct reports. Do the math on just one 30-minute one-on-one a week with 31 people. That is more than 15 hours a week in one-on-ones alone, before any other part of the job.
It does not happen. So the one-on-ones stop. Reviews get rushed. Some leaders in that situation were turning to AI to write their people's performance reviews. Nobody felt seen.
Restructures made it worse. In one, leaders were given more stores and more span of control with no increase in pay. In another, leadership was split so one person ran the front of the store and another ran the pharmacy. Each leader's store count went from about 15 to 30, with no change management: no conversation guides, no role plays, little explanation of why. It became one of our lowest engagement years.
If a manager's job cannot be done well, it will not be done well. Before you hold managers accountable for retention, make sure the job is possible.
The four-part accountability loop
Manager training without accountability is like teaching someone to swim and never checking if they get in the pool. A manager who only talks to people at review time is like a coach who only shows up on game day. The development was supposed to happen in practice.
1. Measure. Every manager gets a short scorecard each quarter: their team's turnover against the company average, how many people on their team are flagged as Intervention needed or Critical, how often they actually hold one-on-ones, and whether flagged people got a real conversation. Their own manager sees it too.
2. Set a standard. Write it down. For example: weekly check-ins for anyone flagged as Intervention needed or Critical. Every Critical person gets a real conversation within the week. Team turnover no more than five points above the company average without a clear reason and a plan.
3. Attach a consequence. Retention shows up in performance reviews and promotion decisions. A manager who keeps losing good people is not promoted for strong output alone.
4. Give support. Every manager below the standard gets coaching, a simple stay interview guide and a monthly check-in with their own manager until it improves. The goal is to build the skill, not to punish.
The loop only works if all four parts run. Measurement without consequence is a report. Consequence without support is fear. And fear is how you end up with a team that tells you what you want to hear.
How EIP helps
Council View shows where turnover hides behind the company average. A company-wide number can look fine while one manager's team is losing people. Council View shows you which team, and our advisors go through it with you every month.
Flight Risk Score™ (patent pending) reads the manager relationship as one of its four areas, including manager changes, meeting frequency and teammates leaving, and flags who needs a conversation now.
Our Council of current and former executives reviews the findings before anything is recommended. Then we stay with you through the fix.
Start with a conversation: eip360.com | [email protected]
Sources
Gallup. State of the American Manager. 2015. gallup.com/workplace/231593
Tatel, C. and Wigert, B. "42% of Employee Turnover Is Preventable but Often Ignored." Gallup, July 9, 2024, updated February 16, 2026. gallup.com/workplace/646538
Stories and results are from the author's own career at a Fortune 10 company. Names, places and identifying details are withheld.
No. 20 · DraftHire People Built to StayWhy most turnover is decided before day one, and how to fix the front end of hiring
Brett Kiley, Founder and CEO, Experience Improvement Partners | October 2026
Buying a car from the brochure
Hiring off a resume is like buying a car based on the brochure. It looks great on paper. You do not know how it drives until you are already behind the wheel.
Most hiring processes are built to answer one question: can this person do the job? That question matters on day one. It says almost nothing about whether they will still be doing it in year three.
Leadership IQ's widely cited study of more than 5,000 hiring managers found that 46% of new hires failed within 18 months, and that 89% of those failures came down to attitude, motivation and fit, not technical skill. The study is from 2005. Most hiring processes have not changed much since.
Posting a job without knowing what good looks like is like casting a movie without a script. You will get people who can act. You will have no idea if they are right for this part.
Your four kinds of employee
Every workforce sorts into four groups by two questions: do they perform, and do they stay?
| Leaves early | Stays long | |
|---|---|---|
| High performer | Avoidable loss. The people you most regret losing. | The profile to hire for. |
| Low performer | Acceptable churn. | An accountability gap. Managed around, not managed. |
Most companies hire for the top row, high performers, and hope they stay. The real target is one box: people who perform and stay. Your best long-tenured people are not there by accident. They came in with something. Most companies have never found out what it was.
Find the 3 to 5 traits your best people share
Your long-tenured high performers share a handful of traits. Not skills. Traits. How they handle a bad day. Whether they find meaning in repetitive work or need constant change. What they do when something breaks and nobody is around to ask.
These traits are specific to your company and your work. A distribution center will not share them with a hospital. You have to find your own.
1. Pull the right list. Everyone with three or more years of tenure who is also rated in your top performance tier. You need both filters. Long tenure alone is not the target.
2. Talk to them. Not a survey. Ask what they knew about this kind of work before they started, why they said yes, what their first 90 days were like when something went wrong, and what almost made them leave in year one.
3. Look for what repeats. You will usually find 3 to 5 traits that show up in nearly every conversation and are missing in the people who left early. They are almost never what the job posting asks for.
4. Rebuild the front end around them. Where you recruit, what the posting says, the interview questions and how answers are scored.
5. Measure it. Track how many new hires are still there at 90 days and at one year, for people hired the new way against people hired the old way.
You can start this without any software. Ten conversations with your ten longest-tenured high performers will give you a first draft.
What we did: a hiring redesign that went company-wide
Before I founded EIP, I spent 20 years in operations at a Fortune 10 company. My region was one of the pilots for a redesign of how we interviewed and hired.
For years we interviewed the way most companies still do. Tell me about your strengths. Tell me about your weaknesses. Where do you see yourself in five years? Those questions had probably been passed down since the company was founded. None of them told us whether someone would succeed in the job.
So we looked at the people who did succeed and stay, and wrote down what they had in common.
Then we stopped asking people to describe themselves. We never asked, "Are you dependable?" Everyone says yes. We asked behavioral questions instead. Tell me about a time when. What would you do if.
For the medical side, we simply talked through medications and medical terms with candidates to see whether it interested them. If someone did not enjoy that part, they were not going to enjoy the job.
We also sped everything up. Getting hired went from about two weeks to one. Onboarding paperwork, background checks and drug tests went from about 30 days to 15. Time from applying to starting went from roughly six weeks to three.
It worked well enough that it rolled out to more than 1,200 stores, and then across the company. It was Hire Smart before it had a name.
6 to 3
weeks from applying to starting
1,200+
stores after the pilot
42% to 15%
seasonal hires lost before their first day on the job
The same thinking changed our seasonal hiring in another part of the company. Every year we hired about 2,000 people for our busiest season, and 42% of them were gone before January 1, the day they were supposed to start taking calls. After we redesigned how we hired, that fell to 15%. That was about 540 more trained people in a seat on day one.
Tell the truth in the job posting
A distribution center that supplied my stores had turnover of 97%. One of the causes was the hiring pitch.
Recruiters told candidates: come work for us. It is a big name and a family culture. We will take care of you. Work 40 hours, and pick up overtime if you want it.
Then new hires showed up on day one. Their supervisor was on the line, short-staffed and stressed, with no time to train anyone. The overtime was not optional. It was mandatory, on Saturdays, and refusing it could get you written up and eventually let go.
The pitch described the company people wanted to work for, not the job they were walking into. New hires found out the difference in the first week, and many of them left.
When leaders become recruiters
The center did not have enough people to run interviews, so the head of the warehouse was interviewing frontline candidates himself. Every hour he spent interviewing was an hour he was not leading, training or running the operation. The goal became getting bodies in the door. That is how a hiring problem turns into a turnover cycle.
An honest posting will get you fewer applicants. It will get you the right ones. Describe the hard parts: the schedule, the overtime, the physical demands, the pace. The people who still apply are the people who will stay.
Do not pay new people more to stay than loyal people
Some of our remote stores were among the busiest in the region but sat in the lowest pay tier, so no pharmacist wanted to move there. To fill them, pharmacist sign-on bonuses climbed from $10,000 to $20,000 and eventually as high as $100,000.
It filled some stores. It also taught our loyal people a lesson we did not intend. New hires could out-earn people with years of tenure, and the tenured people were training them. Some realized they could quit, come back and earn more than if they had stayed.
We later added a two-year hold to the bonuses after some early hires quit within a month. The bigger lesson was this: whatever you pay to attract people, check what it tells the people who already stayed.
Onboarding is the last step of hiring
Gallup has found that only 12% of employees strongly agree their organization does a great job onboarding new people.
A generic onboarding packet is like handing someone a map of the wrong city. It is technically a map. It just does not get them anywhere, and now they think it is their fault they are lost.
I lived this one myself. Sixteen years into my career, I moved from our retail business into a different business unit, as an executive director leading client retention and customer experience. It might as well have been a different company.
My new boss did not meet me on my first day, or my second. On day two he called to check in. We talked for 30 minutes about golf and guitars, not about the job. There was no learning plan and no list of who to meet. The message was: figure it out.
So I did. I built my own learning plan and introduced myself to the people I needed to know. Other people who joined that team told me the same story. It was simply how things were done there.
I ended up contributing a lot in that role. But those first weeks made me feel like I was just taking up space. If that happens to someone 16 years into their career, imagine what it does to a 22-year-old in their first real job.
What to do instead
1. Find your 3 to 5 traits. Ten conversations with your longest-tenured high performers.
2. Rewrite one job posting. Your highest-turnover role. Describe the real job, including the hard parts.
3. Add one question per trait. And train interviewers on what a strong and a weak answer sound like.
4. Cut the wait. Every week between yes and day one is a week a better offer can arrive.
5. Give every new hire a plan and a person. Who to meet, what to learn and when the manager will check in.
6. Check your bonuses against your loyal people. If a new hire can out-earn a five-year employee, fix it.
How EIP helps
Hire Smart™ builds your hiring around what your longest-tenured people have in common, so the people you do hire are more likely to stay. We model your four types of employee, find the 3 to 5 traits your best long-tenured people share, and redesign six parts of hiring around them: where you recruit, job postings, interview questions and scoring, who interviews, pay and environment, and performance feedback. Candidates are scored on behavior, not resume keywords.
Our Council of current and former executives reviews the findings before anything is recommended. Then we stay with you through the fix.
Start with a conversation: eip360.com | [email protected]
Sources
Leadership IQ. "Why New Hires Fail." 2005. Study of 5,247 hiring managers. leadershipiq.com
Gallup. Onboarding research. gallup.com/workplace/247172
Stories and results are from the author's own career at a Fortune 10 company. Names, places and identifying details are withheld.